Dashboard & Monitoring
Unified Dashboard
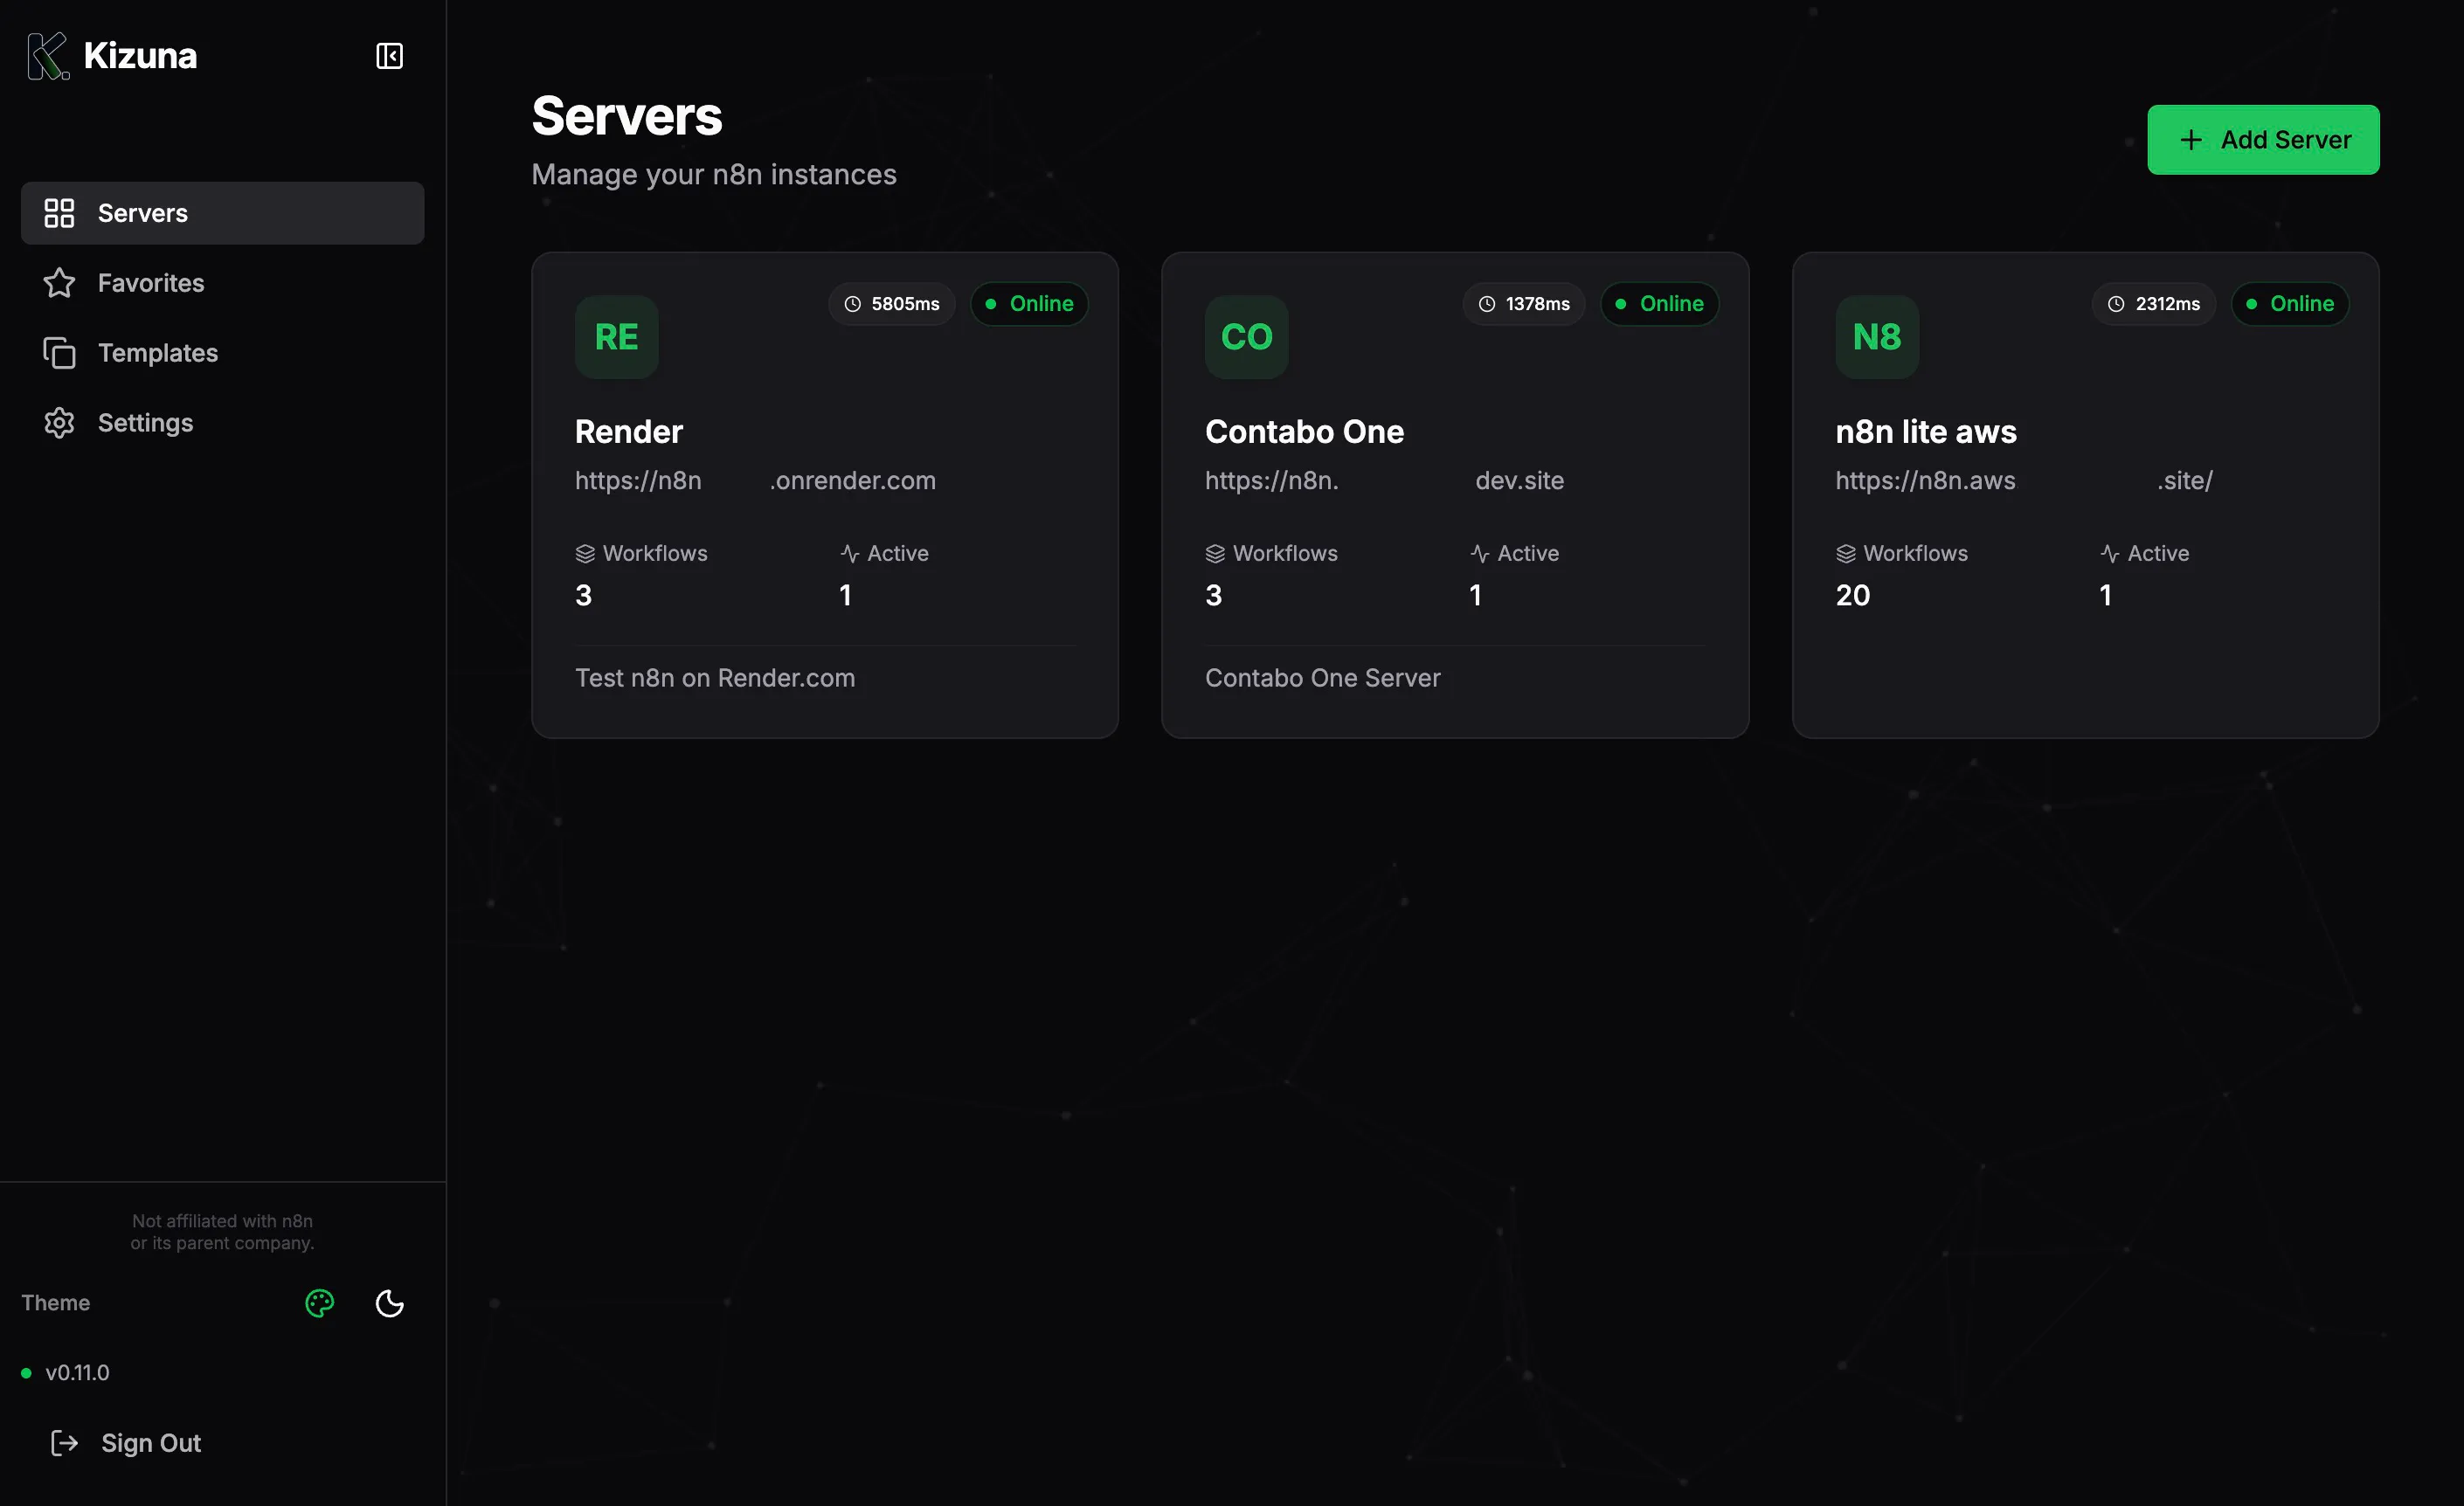
Section titled “Unified Dashboard”The Kizuna Dashboard is your control center. It replaces the need to keep ten browser tabs open for different n8n environments.
Key Metrics at a Glance
Section titled “Key Metrics at a Glance”For every connected server, the dashboard streams real-time data:
- Status Indicator: Instant visual feedback (Green/Red) on server health.
- Latency: Measured in milliseconds (ms). High latency can indicate server load or network issues.
- Active Workflows: Count of currently active workflows.
- Total Executions: (If supported by n8n version) Total number of workflow executions.
- Version: The specific version of n8n running on that instance (e.g.,
1.77.0).
Parallel Loading Architecture
Section titled “Parallel Loading Architecture”Kizuna uses a non-blocking, parallel loading architecture.
- Each server card loads independently.
- If one server is slow or offline, it does not freeze the rest of the dashboard.
- Skeleton loaders provide a smooth visual experience while data is fetching.
Actions
Section titled “Actions”From the dashboard card, you can:
- Open n8n: Quick link to jump directly to the instance interface.
- Refresh: Force a status check.
- Edit/Delete:Manage server configuration.